
The official charts library inABMaterial is Chartist, but because of its many features it is also a rather slow rendering js/css library and not always that easy to implement. On the B4X forum, Mashiane has created a nice ABMCustomComponent wrapper for the JQPlot plugin and there are many examples in the forum on how to implement Google Charts in ABM, like this post from Harris.
So why yet another one? Well the main focus on this wrapper is being fast AND easy to implement. Of course this also means less tunable features but I have found that maybe for 95% of our needs having some basic stuff like a tooltip and being clickable is actually enough.
I came accross the Frappé charts javascript library. It has tooltips, some interactions and animations. And it is bloody fast! 🙂
I only had to make a couple of CSS changes to make it ABM compatible and the ABMCustomComponent wrapper was very easy to write.
Usage:
Create your chart variables in Class_globals:
Dim FrappeChart1 As FrappeChart
Dim FrappeChart2 As FrappeChart
Dim FrappeChart3 As FrappeChart
Dim FrappeChart4 As FrappeChart
Dim FrappeChart5 As FrappeChart
Dim FrappeChart6 As FrappeChart
Dim FrappeChart7 As FrappeChart
In Page_Connect(), make your charts (you immidately can see the simplicity of the code):
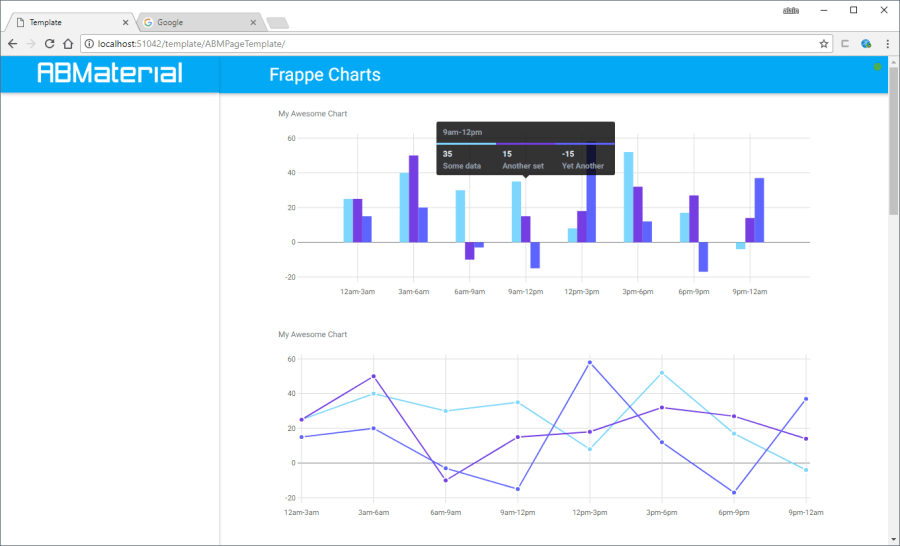
FrappeChart1.Initialize(page, "FrappeChart1", "bar", "My Awesome Chart", 250)
FrappeChart1.FrappeLabels.AddAll(Array As String("12am-3am", "3am-6am", "6am-9am", "9am-12pm","12pm-3pm", "3pm-6pm", "6pm-9pm", "9pm-12am"))
FrappeChart1.AddDataSet("Some data", "light-blue", Array As Int(25, 40, 30, 35, 8, 52, 17, -4), Array As String())
FrappeChart1.AddDataSet("Another set", "violet", Array As Int(25, 50, -10, 15, 18, 32, 27, 14), Array As String())
FrappeChart1.AddDataSet("Yet Another", "blue", Array As Int(15, 20, -3, -15, 58, 12, -17, 37), Array As String())
page.Cell(1,1).AddComponent(FrappeChart1.ABMComp)
FrappeChart2.Initialize(page, "FrappeChart2", "line", "My Awesome Chart", 250)
FrappeChart2.FrappeLabels.AddAll(Array As String("12am-3am", "3am-6am", "6am-9am", "9am-12pm","12pm-3pm", "3pm-6pm", "6pm-9pm", "9pm-12am"))
FrappeChart2.AddDataSet("Some data", "light-blue", Array As Int(25, 40, 30, 35, 8, 52, 17, -4), Array As String())
FrappeChart2.AddDataSet("Another set", "violet", Array As Int(25, 50, -10, 15, 18, 32, 27, 14), Array As String())
FrappeChart2.AddDataSet("Yet Another", "blue", Array As Int(15, 20, -3, -15, 58, 12, -17, 37), Array As String())
page.Cell(1,1).AddComponent(FrappeChart2.ABMComp)
FrappeChart3.Initialize(page, "FrappeChart3", "scatter", "My Awesome Chart", 250)
FrappeChart3.FrappeLabels.AddAll(Array As String("12am-3am", "3am-6am", "6am-9am", "9am-12pm","12pm-3pm", "3pm-6pm", "6pm-9pm", "9pm-12am"))
FrappeChart3.AddDataSet("Some data", "light-blue", Array As Int(25, 40, 30, 35, 8, 52, 17, -4), Array As String())
FrappeChart3.AddDataSet("Another set", "violet", Array As Int(25, 50, -10, 15, 18, 32, 27, 14), Array As String())
FrappeChart3.AddDataSet("Yet Another", "blue", Array As Int(15, 20, -3, -15, 58, 12, -17, 37), Array As String())
page.Cell(1,1).AddComponent(FrappeChart3.ABMComp)
FrappeChart4.Initialize(page, "FrappeChart4", "pie", "My Awesome Chart", 250)
FrappeChart4.FrappeLabels.AddAll(Array As String("12am-3am", "3am-6am", "6am-9am", "9am-12pm","12pm-3pm", "3pm-6pm", "6pm-9pm", "9pm-12am"))
FrappeChart4.AddDataSet("Some data", "light-blue", Array As Int(25, 40, 30, 35, 8, 52, 17, -4), Array As String())
FrappeChart4.AddDataSet("Another set", "violet", Array As Int(25, 50, -10, 15, 18, 32, 27, 14), Array As String())
FrappeChart4.AddDataSet("Yet Another", "blue", Array As Int(15, 20, -3, -15, 58, 12, -17, 37), Array As String())
page.Cell(1,1).AddComponent(FrappeChart4.ABMComp)
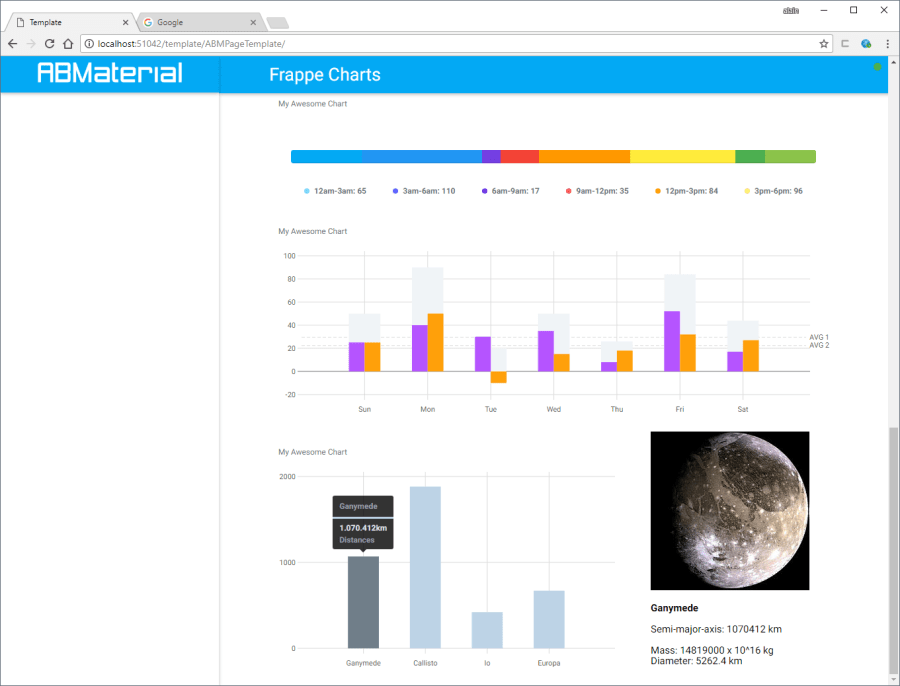
FrappeChart5.Initialize(page, "FrappeChart5", "percentage", "My Awesome Chart", 250)
FrappeChart5.FrappeLabels.AddAll(Array As String("12am-3am", "3am-6am", "6am-9am", "9am-12pm","12pm-3pm", "3pm-6pm", "6pm-9pm", "9pm-12am"))
FrappeChart5.AddDataSet("Some data", "light-blue", Array As Int(25, 40, 30, 35, 8, 52, 17, -4), Array As String())
FrappeChart5.AddDataSet("Another set", "violet", Array As Int(25, 50, -10, 15, 18, 32, 27, 14), Array As String())
FrappeChart5.AddDataSet("Yet Another", "blue", Array As Int(15, 20, -3, -15, 58, 12, -17, 37), Array As String())
page.Cell(1,1).AddComponent(FrappeChart5.ABMComp)
FrappeChart6.Initialize(page, "FrappeChart6", "bar", "My Awesome Chart", 250)
FrappeChart6.FrappeLabels.AddAll(Array As String("Sun", "Mon", "Tue", "Wed", "Thu", "Fri", "Sat"))
FrappeChart6.AddDataSet("Some data", "purple", Array As Int(25, 40, 30, 35, 8, 52, 17), Array As String())
FrappeChart6.AddDataSet("Another set", "orange", Array As Int(25, 50, -10, 15, 18, 32, 27), Array As String())
FrappeChart6.FrappeShowSums = True
FrappeChart6.FrappeShowAverages = True
page.Cell(1,1).AddComponent(FrappeChart6.ABMComp)
FrappeChart7.Initialize(page, "FrappeChart7", "bar", "My Awesome Chart", 300)
FrappeChart7.FrappeLabels.AddAll(Array As String("Ganymede", "Callisto", "Io", "Europa"))
FrappeChart7.AddDataSet("Distances", "grey", Array As Int(1070.412, 1882.709, 421.700, 671.034), Array As String("1.070.412km", "1.882.709km", "421.700km", "671.034km"))
FrappeChart7.FrappeIsNavigable = True
FrappeChart7.FrappeRaiseEventOnClick = True
page.Cell(2,1).AddComponent(FrappeChart7.ABMComp)
An example of the Click event on Chart7:
Sub FrappeChart7_Clicked(index As Int)
   Dim img As ABMImage = page.Component("img")
   Dim lbl As ABMLabel = page.Component("lbl")
   Select Case index
     Case 0
       img.Source = "../images/ganymede.jpg"
       lbl.Text = "{B}Ganymede{/B}{BR}{BR}Semi-major-axis: 1070412 km{BR}{BR}Mass: 14819000 x 10^16 kg{BR}Diameter: 5262.4 km"
     Case 1
       img.Source = "../images/callisto.jpg"
       lbl.Text = "{B}Callisto{/B}{BR}{BR}Semi-major-axis: 1882709 km{BR}{BR}Mass: 10759000 x 10^16 kg{BR}Diameter: 4820.6 km"
     Case 2
       img.Source = "../images/io.jpg"
       lbl.Text = "{B}Io{/B}{BR}{BR}Semi-major-axis: 421700 km{BR}{BR}Mass: 8931900 x 10^16 kg{BR}Diameter: 3637.4 km"
     Case 3
       img.Source = "../images/europa.jpg"
       lbl.Text = "{B}Europa{/B}{BR}{BR}Semi-major-axis: 671034 km{BR}{BR}Mass: 4800000 x 10^16 kg{BR}Diameter: 3121.6 km"
   End Select
   img.Refresh
   lbl.Refresh
End Sub
Some more examples of charts generated with this code:

Attached are the FrappeChart.bas and the frappe-charts.min.iife.js files. Copy the .js file to the /www/js/custom/ folder and import the .bas file.
http://gorgeousapps.com/FrappeChart.zip
Alwaysbusy
Click here to  and support ABMaterial
